The dashboard shows graphs relating to tenders that have been awarded.
Hover over each graph for more detailed information.
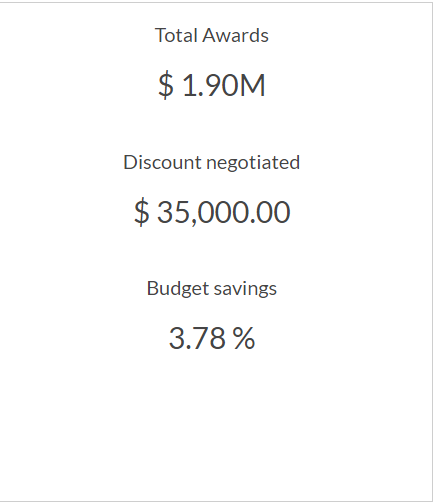
Total awarded
List the total awarded cost for ALL awarded contract, total negotiated discounts and budget saving in %.
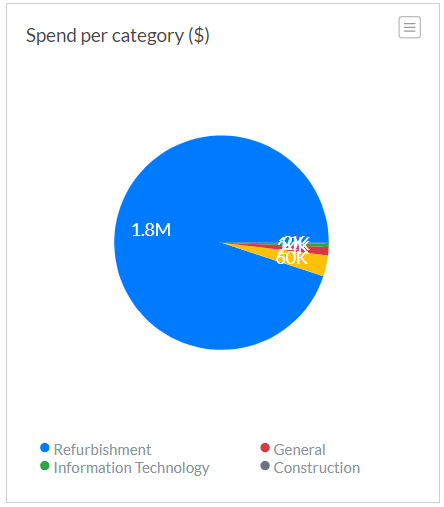
Spend per category
Pie chart showing the total awarded spend for each category.
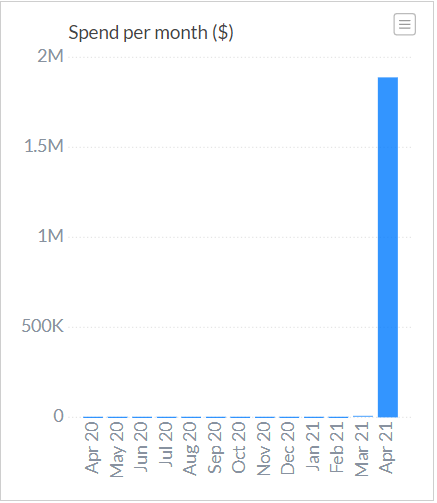
Spend per month
Bar chart showing the total awarded spend for each month.
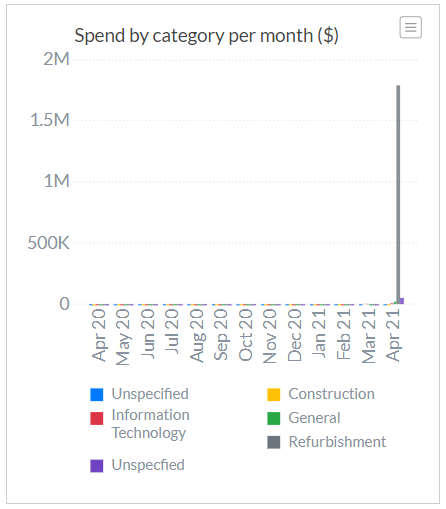
Spend by category per month
Bar chart showing the total awarded spend per month for each category.
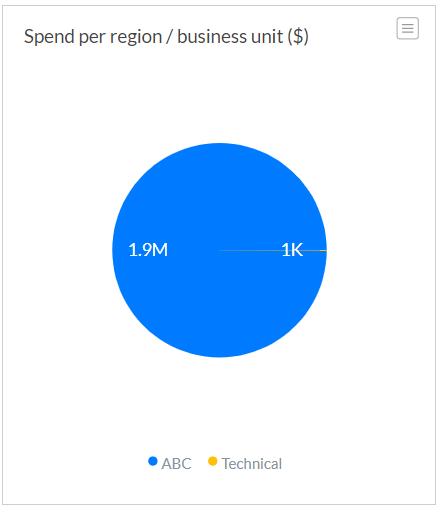
Spend per region / business unit
Pie chart showing the total spend per region / business unit.
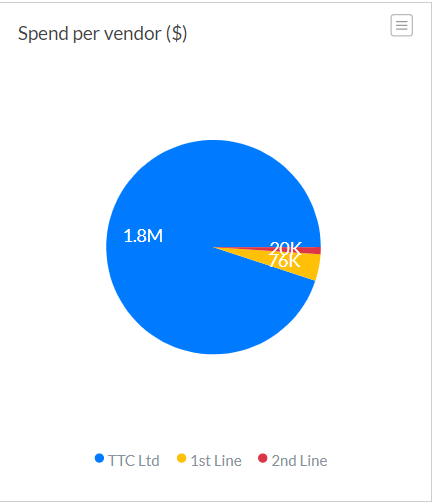
Spend per vendor
Pie chart showing the total awarded spend per vendor.
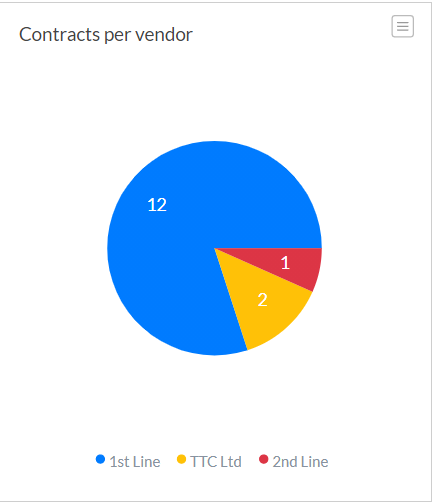
Contracts per vendor
Pie chart showing the total awarded contracts per vendor.
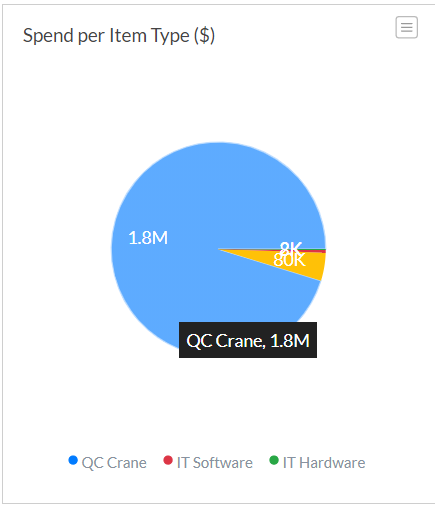
Spend per item type
Pie chart showing the total awarded spend per item type.
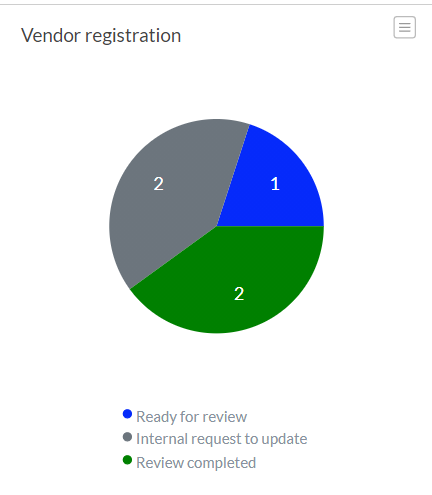
Vendor registration
Pie chart showing vendor registration phases.