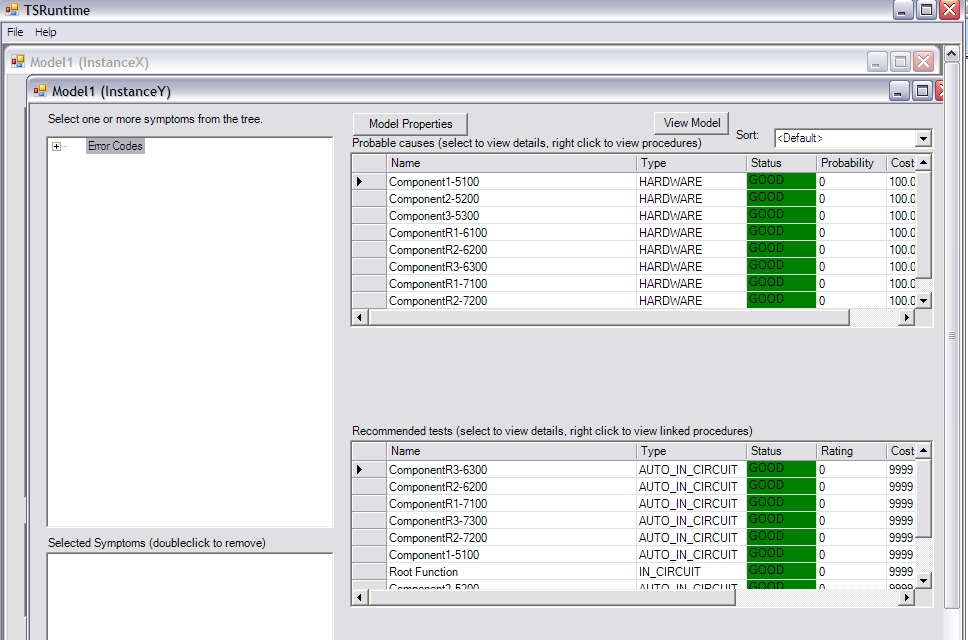
When you first load a model, one window will open for each instance of the model and you can switch between these and simulate troubleshooting sessions.
The runtime interface consists of 3 main areas:
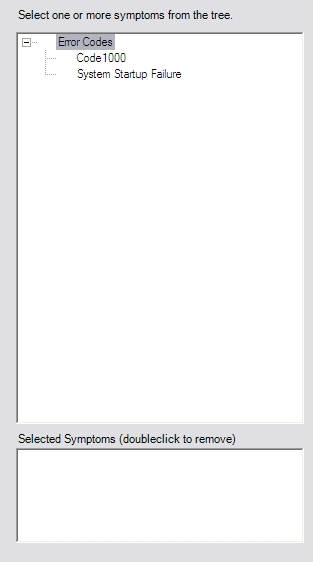
The symptom list where all visible symptoms are displayed and you may select a symptom for troubleshooting.
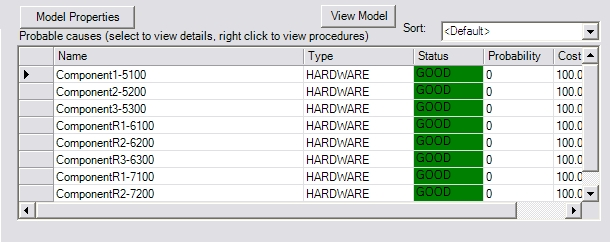
The component list, which lists all components in their model along with their type, status, probability of failure, cost- to-replace and time-to-replace information.
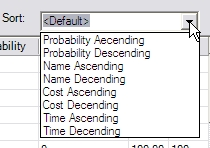
By default this list is sorted from highest to lowest probability. You may select other sort orders.
To change the sort order, select it from the drop-down list:
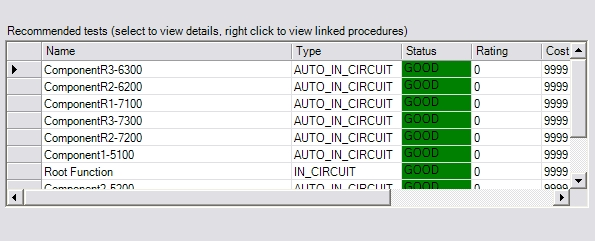
The list of available tests, which can be used to report test results. This list is sorted by recommendation from the most recommended test down to the least recommended test.